The CFO's Guide to AP Automation ROI (2026 Formula)
Calculate AP automation ROI with the actual formula, worked scenarios across three company sizes, and a framework ready for your board presentation.
Most CFOs already suspect that AP automation would save money. The question isn't whether the ROI exists. It's whether the numbers are strong enough to justify prioritizing it over every other initiative competing for budget.
This guide gives you the framework to calculate AP automation ROI for your specific organization, using your own invoice volumes and cost structure. No generic promises. Just the formula, the inputs, and the benchmarks to build a business case that holds up in a board presentation.
The Formula
AP automation ROI is straightforward once you have the inputs:
ROI = (Total Annual Benefits - Total Annual Cost) / Total Annual Cost x 100
The complexity isn't in the formula. It's in accurately capturing the benefits, which fall into two categories: direct savings you can tie to a line item, and indirect benefits that are real but harder to quantify.
Direct Savings: The Numbers You Can Prove
These are the ROI components that show up clearly in financial reports.
Cost per invoice reduction. The average organization spends $12.88 processing an invoice manually. Best-in-class automated teams bring that to $2.78. The savings per invoice is $10.10, and you multiply that by your annual volume to get the baseline.
For a company processing 500 invoices per month, that's $60,600 in annual savings from processing cost reduction alone.
Early payment discount capture. Most vendor contracts include a discount for paying within 10 days, typically 1 to 3% of the invoice amount. When your average processing cycle is 17 days, those discounts expire before the invoice clears approval. Automation cuts cycle time to 3 days, putting discounts back on the table.
If your annual payables total $2 million and you capture a 2% discount on even half of that, you're adding $20,000 in annual savings that didn't require cutting costs or negotiating new terms. You're just paying the same bills faster.
Late payment penalty elimination. Late fees vary by vendor, but 1.5% monthly interest on overdue balances is standard. For a business with $200,000 in monthly payables and a 10% late payment rate, that's roughly $3,600 per year in avoidable penalties.
Error correction reduction. Manual AP processes carry error rates between 1 and 3%. Each error triggers investigation, communication, and re-processing. At an average cost of $25 per error correction and 3% of 6,000 annual invoices, that's $4,500 in annual correction costs that automation virtually eliminates.
For a detailed breakdown of where these costs come from, including components most teams overlook, see our analysis of the real cost of manual invoice processing.
Indirect Benefits: The ROI That Doesn't Fit in a Spreadsheet
These benefits are harder to assign a dollar value but often drive more long-term value than the direct savings.
Headcount avoidance. This isn't about layoffs. It's about growth. When invoice volume doubles because the business is scaling, automated teams absorb the increase without hiring. Manual teams need to add headcount at $50,000 to $70,000 per employee annually, plus three to six months of ramp-up time before the new hire reaches full productivity. The first time your volume grows and you don't need to hire, the ROI of automation accelerates dramatically. For companies in high-growth phases, this single factor often outweighs all direct savings combined.
Audit preparation time. Manual AP teams routinely spend weeks pulling documentation for audits. Automated systems maintain complete digital audit trails that can be generated in hours. The labor savings during audit season alone can justify a significant portion of the annual tool cost.
Staff retention. AP roles centered on manual data entry have high turnover. The recruiting, onboarding, and training cost for each replacement averages $15,000 to $25,000. Automation shifts the work from repetitive entry to exception handling and analysis, which reduces attrition and protects institutional knowledge.
Vendor relationships. Paying consistently and on time improves supplier relationships. That translates into better pricing, priority during supply constraints, and more flexible payment terms during cash-tight periods. Difficult to put an exact number on, but any procurement leader will tell you the value is significant.
Cash flow visibility. When every invoice is tracked in real time from receipt to payment, finance teams can forecast cash requirements with precision. No more estimating what's been approved versus what's still pending. This visibility doesn't save money directly, but it prevents the costly decisions that come from operating without accurate data.
For industry-specific ROI benchmarks that strengthen your business case, our invoice automation by industry guide provides sector-specific data across healthcare, manufacturing, and professional services.
Running the Calculation for Your Organization
Here's how to build your own ROI estimate in under 30 minutes.
Step 1: Establish your baseline. Pull three numbers: monthly invoice volume, current average cost per invoice, and total annual payables. If you don't know your cost per invoice, use $12.88 as a conservative industry average. For a more precise figure, add up your AP team's fully loaded labor cost (salary, benefits, overhead) and divide by annual invoices processed. Include the cost of any tools, software, and physical materials your team uses for AP. Most organizations are surprised to find their true cost per invoice is higher than they assumed because they've never accounted for the fully loaded figure.
Step 2: Calculate direct savings. Multiply your monthly volume by 12, then by the difference between your current cost per invoice and $2.78 (best-in-class automated cost). Add early payment discount potential (1.5% of annual payables is a conservative estimate for newly captured discounts). Add late fee elimination based on your current late payment rate.
Step 3: Estimate tool cost. Modern AP automation tools range from free tiers for low-volume businesses to $500 per month for mid-market teams processing several thousand invoices. Enterprise solutions with deep ERP integration run higher but typically stay well below the savings they generate. If you need a hands-on walkthrough of vendor evaluation and setup, our guide on how to automate invoice processing in five steps covers the practical side.
Step 4: Calculate ROI. Subtract annual tool cost from total annual benefits. Divide the result by the tool cost. Multiply by 100 for a percentage.
For reference, our manual vs automated AP comparison breaks down the benchmark data behind these calculations across seven key metrics.
What the Numbers Typically Look Like
Industry research consistently shows AP automation payback periods of 6 to 12 months. For many organizations, especially those processing more than 500 invoices monthly, payback happens in under 4 months.
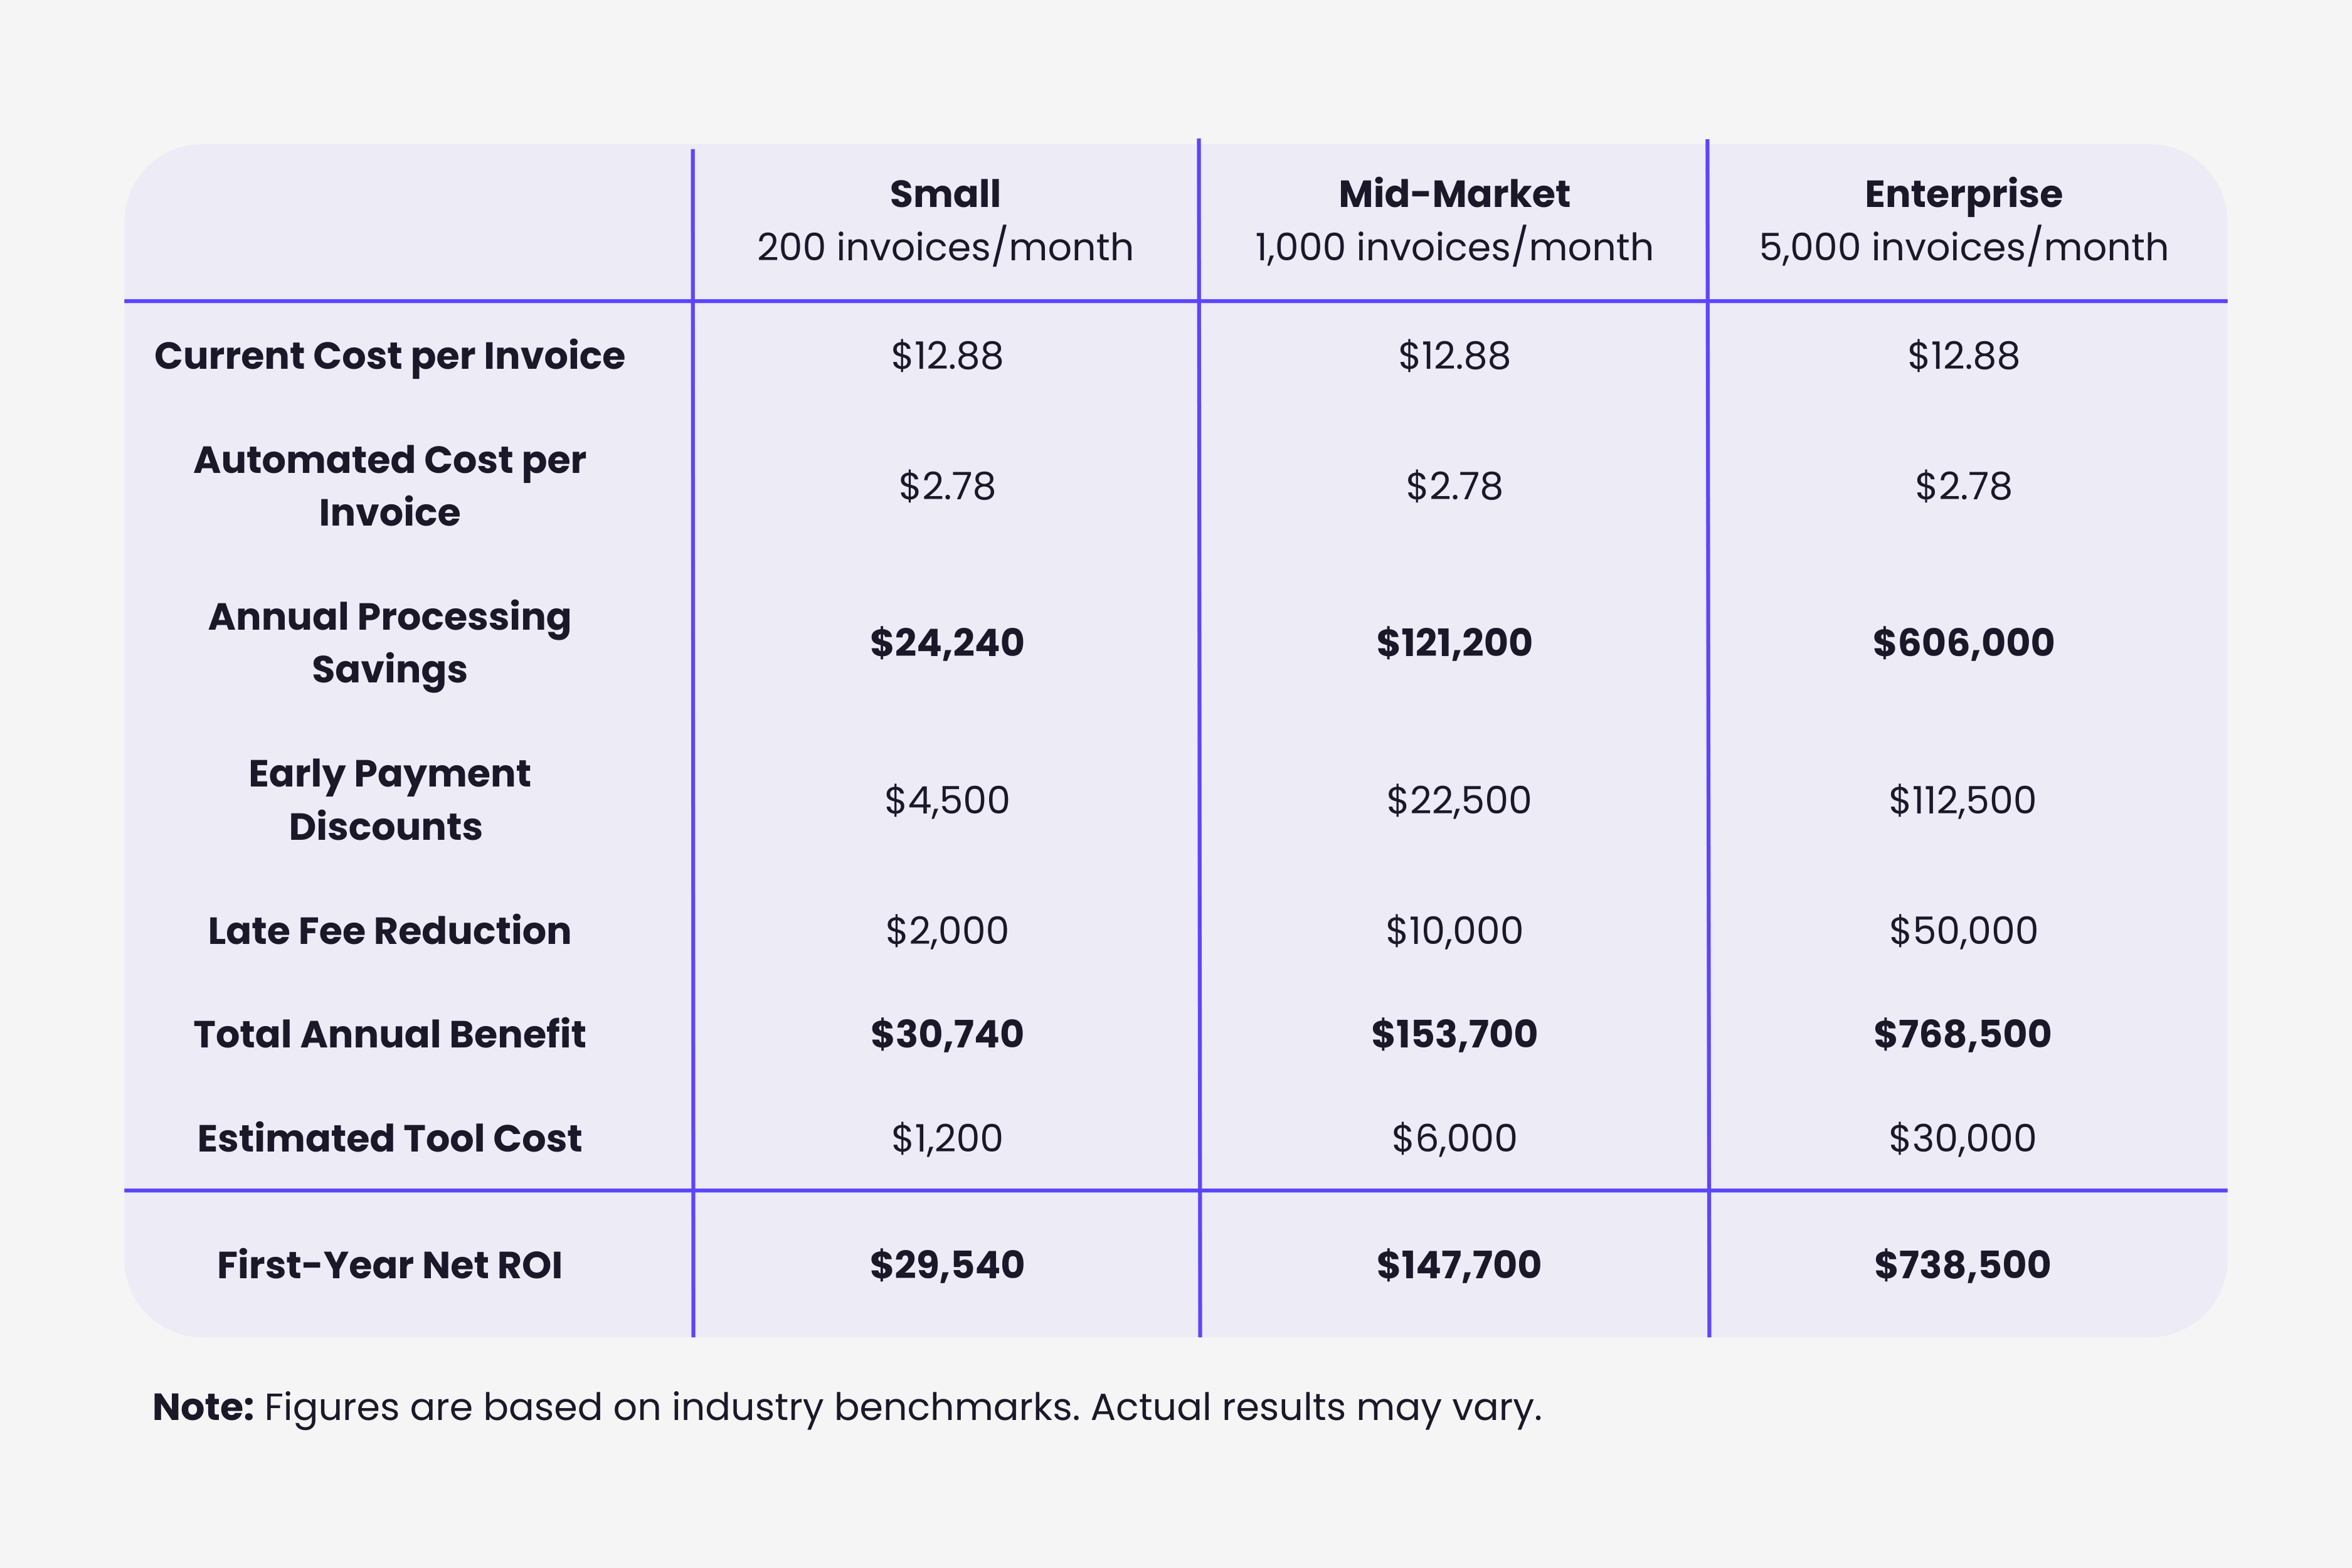
For a small business processing 200 invoices per month, the math still works. At $12.88 per invoice, annual processing costs $30,912. Automation brings that to $6,672, saving $24,240 on processing alone. With a free or low-cost tool at $100 per month, the first-year net benefit is over $23,000. That's enough to fund a new hire, invest in marketing, or simply improve margins.
A mid-market company processing 1,000 invoices per month at $12.88 each spends $154,560 annually on AP processing. Automation at $2.78 per invoice brings that to $33,360, a direct savings of $121,200. Add $15,000 in captured early payment discounts and $4,000 in eliminated late fees, and the total annual benefit reaches $140,200.
Against a tool cost of $6,000 to $12,000 per year, the first-year net benefit lands between $128,000 and $134,000. That's an ROI above 1,000%.
Even at half those savings, with conservative estimates across every variable, the ROI still exceeds 400%. The business case isn't marginal. It's overwhelming.
Building the Business Case
When presenting to a board or leadership team, lead with three things: the current annual cost of AP processing (hard number, verifiable), the projected annual savings with automation (calculated using the steps above), and the payback period (divide annual tool cost by monthly savings to get the number of months until breakeven).
Keep the presentation under 10 slides. Include the formula, your inputs, the result, and one slide on indirect benefits. Decision-makers at this level don't need to be convinced that automation works. They need to see that someone has done the math for their specific situation. The strongest business cases also include a sensitivity analysis: show the ROI even if savings come in at 50% of projection. When the worst-case scenario still delivers a positive return, the decision becomes straightforward.
For the full implementation playbook covering vendor selection, phased rollout, and change management, see our complete AP automation implementation guide.
If you want to see the math in action before building the business case, start free with Gennai. Connect your email, process your first batch of invoices, and use the real results to build a projection your CFO can't argue with.
Ready to automate your invoices?
Start extracting invoices from your email automatically with Gennai. Free plan available, no credit card required.
Start FreeRelated Articles
Invoice vs receipt: which one your accountant actually wants
Invoice vs receipt explained: the invoice records the expense and supports a VAT or GST reclaim, the receipt only proves you paid. Here is which one to keep.
GuideWhat to do when a supplier sends the wrong invoice
A supplier sent the wrong invoice? Here is what to do: identify the error, ask for a corrected invoice or credit note, and hold payment until it is right.
GuideAuto-categorize QuickBooks invoices by supplier: how AI learns your chart of accounts
Auto-categorize QuickBooks invoices by supplier: AI applies the right account, class and location to each bill at ingestion, before it ever hits your bank feed.